In our seminar rooms or comfortably from home!
Our bestseller workshops


Seminartermine nach Kategorien
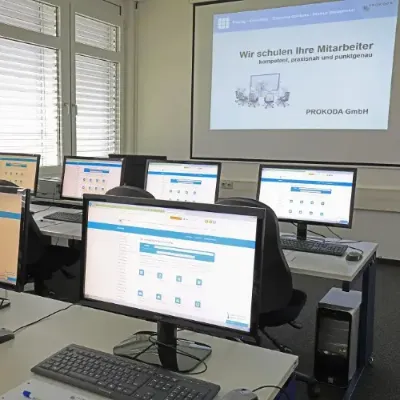
You can rent our seminar rooms!
Your booking with us is transparent and flexible, without hidden costs. Our seminar rooms in Cologne not only offer pleasant air conditioning, but are also equipped with high-quality technology such as PCs, flat screens and projectors.


PowerPoint Slides with WOW Effect
Half-Day Workshop
With the new "Zoom" and "Morph" features (Office 365), you can ensure a spectacular and professional presentation at your next talk. Both innovations offer you an easy way to stand out from the usual standard presentations.
Workshop Content
How the Morph Effect Changes the Impact of Your Slides
- Learn about and use various morph techniques
How to Use Morphing in Practice
- Concrete examples for practicing and optimizing
How Zoom Easily Adds Interactivity to a Presentation
- What the three Zoom variants can do and how to use them
Perfect for Presenters Who Want to Engage Their Audience
- How the Summary Zoom automatically creates an interactive agenda in seconds
Optimal Navigation and Orientation for the Audience
- Using Section Zoom and Slide Zoom to make the interaction in a presentation even more flexible
Advanced Techniques and Troubleshooting
- Use professional techniques and avoid typical pitfalls
How to Make Your Presentations Great with This Combination
- Practical examples of how slide content can be spectacularly presented using the combination of Morph and Zoom
Who Should Attend This Workshop?
Professionals from all fields looking for easy-to-implement ideas for modern presentations
Presenters who want to prepare their presentations with more dynamics and interactivity to better engage the audience
Dashboards & Excel Reports – Creating Informative and Clear Dashboards
2-Day Workshop
In an increasingly data-driven business world, meaningful dashboards are crucial for effective decision-making. Our seminar provides you with comprehensive insights on how you can ease your daily tasks by using dashboards.
Learn how to capture key performance indicators at a glance with gauge charts, and how dynamic dashboards can help you display complex business data clearly. We will give you valuable tips for printing your reports and show you the right combination of pivot tables, slicers, and charts to optimally present your data.
This seminar will also help you understand how these tools can assist in making informed strategic decisions and improving your business efficiency.
Workshop Content
Design Rules for Tables
- Using cell formats for better readability
- Custom formats for better presentation
- Comfortable management of workbooks
Data Analysis with Excel
- Structuring tables and lists meaningfully
- Creating dynamic tables
- Performing multidimensional data analysis
Dashboard Fundamentals: Reports
- Creating dynamic status reports
- Visualizing key metrics with traffic lights
- Calculating and displaying rolling periods
- Aggregating and calculating date values
Management Dashboards & Cockpits
- Creating dynamic dashboards from reports
- Filtering values conveniently with slicers
- Inserting mini charts into the dashboard
- Highlighting values with conditional formatting
- Optimally using page layout
- Adding controls for data selection
Transfer Results to PowerPoint
- Integrating tables & charts into slides
- Best practices for data transfer
- Launching Excel from a running PowerPoint presentation
Analysis with Pivot Tables
- Displaying status with the appropriate chart
- Displaying shares in a waterfall chart
- Showing key metrics in a gauge chart
Tips for Presenting Results
- Creating charts with multiple axes
- Consistent scaling on axes
- Inserting dynamic chart labels
Who Should Attend This Workshop?
Anyone who wants to present large amounts of data visually and design meaningful dashboards.
Data Analyst – From Raw Data to Dashboard
2-Day Workshop
A fundamental understanding is crucial: 80% of the effort in data analysis is spent on data acquisition, structuring, data correction, and planning. But how can you efficiently utilize this time and resources?
Our seminar will show you how to optimize your data analysis with the Power Business Intelligence tools. Learn how to import and clean data from different sources and prepare it in a structured way. Find out how to visualize your data meaningfully, whether through georeports or relationship visualization.
Workshop Content
Introduction and Overview
- Overview of Power Business Intelligence Tools
- Installation & Download of Add-ins
PowerQuery
- Importing data from external sources
- Importing data from a folder in one step
- Importing data from different sources
- Creating relationships between tables
- Modeling data: Filtering, sorting, and grouping
- Unpivoting data
- Performing calculations in Power Query
Data Analysis with Pivot Tables
- Analyzing data in pivot tables
- Using predefined report layouts & formats
- Customizing pivot table settings
- Grouping pivot table data
- Using timelines & slicers
- Advanced analysis with pivot table functions
- Graphical data analysis with PivotCharts
PowerPivot
- PowerPivot interface & first steps
- Using DAX expressions
- Creating PowerPivot tables
- Resolving PowerPivot tables into CUBE functions
Other Analysis Functions in Excel
- 3D visualization of geographic data
- Creating georeports
- New analysis functions
Power BI Desktop
- Introduction to Power BI Desktop
- Retrieving & transforming data
- Creating relationships
- Creating reports with visuals
Who Should Attend This Workshop?
End users who want to clean, analyze, and visualize data.
Power Automate Basics
1-Day Workshop
With Power Automate, you will learn how to create individual, cross-platform workflows that automate time-consuming business processes and tasks. Streamline your daily work routine and say goodbye to tedious tasks. Following the Power Automate motto: Focus on what matters and automate the rest.
Workshop Content
- User Interface of Power Automate
- Creating Your First Flow Using a Template
(Different Flow Templates, Various Flow Types) - Creating a Flow Without a Template
- Publishing a Flow
- Deleting a Flow
- Editing and Modifying a Flow
- Defining Conditions
- Branching
- Connectors in Power Automate
- Power Automate Interfaces in Office 365
Who Should Attend This Workshop?
This workshop is for participants who want to improve their daily work without technical or programming experience and automate repetitive tasks and processes.
Excel for Controllers
2-Day Workshop
Would you like to navigate through your Excel datasets efficiently, analyze them precisely, and visualize them professionally? In this seminar, you will learn the specific tools and functionalities that Microsoft Excel offers, particularly for controlling.
Discover how to make your work much easier with the right tools and functions. You will learn how to optimally use PivotTables, maneuver confidently through large datasets, and visualize them effectively. With just a few clicks, create insightful charts and learn how to record macros.
Through practical exercises, you will deepen your newly acquired knowledge and gain valuable tips and tricks for using Excel professionally.
Workshop Content
Dynamic Tables
- Advantages
- Editing & calculation
Formulas & Functions
- Data analysis, evaluation, & reporting
- Variance analysis (actual vs. planned)
Data Import with Power Query
- Importing data from various sources
- Avoiding import errors
- Correcting faulty data imports using text functions
- Other features in Power Query
Date, Time, & Text Functions
- Further functions
- Filtering
- VLOOKUP and XLOOKUP
- Simple & nested IF functions
- IF with AND/OR
- SUMIFS/AVERAGEIFS & other conditional functions
- Vertical and horizontal stacking
PivotTables
- Creating and designing
- Calculations within PivotTables
- Conditional formatting
- Slicers & timelines
- Visualization with charts
Macros
- Recording, adjusting, and applying
- Practical examples
Who Should Attend This Workshop?
This workshop is ideal for anyone who wants to use Excel efficiently and purposefully in controlling, especially when it comes to professionally preparing, analyzing, presenting, and automating data.
Data Centre training for many companies:
These customers already trust us
Maximize the security and efficiency of your data center with our certified Data Centre Training. Our practical training courses provide essential know-how on the design, operation and compliance of data centers. Through continuous training, you reduce downtime, minimize sources of error and meet international standards. Benefit from recognised certifications with the globally accredited training courses from PROKODA GmbH & EPI.